A note for DevOps engineers: debugging Linux using BPF
Over the past weekend, the DevCorn 2023 conference took place in Karaganda for developers, project managers, engineers, QA specialists, and those starting their careers in IT. One of the speakers was Askar Sabirov, Server/IaaS Lead at Aitu.Cloud from BTS Digital. Askar shared his experience with BPF in the Linux environment, allowing participants to gain a deeper understanding of modern Linux debugging tools.
Author - Mansur Ismagulov

The Tech AI
Get the key points in seconds - a short summary from The Tech AI.
Askar Sabirov (BTS Digital) describes debugging Linux via eBPF to solve problems that are inaccessible to standard utilities. BPF is a virtual machine in the kernel with low overhead and safe execution through the verifier. For monitoring, bcc-tools and bpftrace are recommended, covering 80% of DevOps engineers' needs.
Askar Sabirov, Server/IaaS Lead at Aitu.Cloud, BTS Digital
The role of a DevOps engineer involves maintaining and managing the Linux environment, ensuring its uninterrupted and efficient operation. However, even with careful planning and management, issues can arise in a Linux environment that require debugging to identify and resolve when standard utilities (top/ps/iostat/etc.) cannot provide comprehensive answers. This is where tools like BPF can be invaluable for monitoring and analyzing your system's performance.
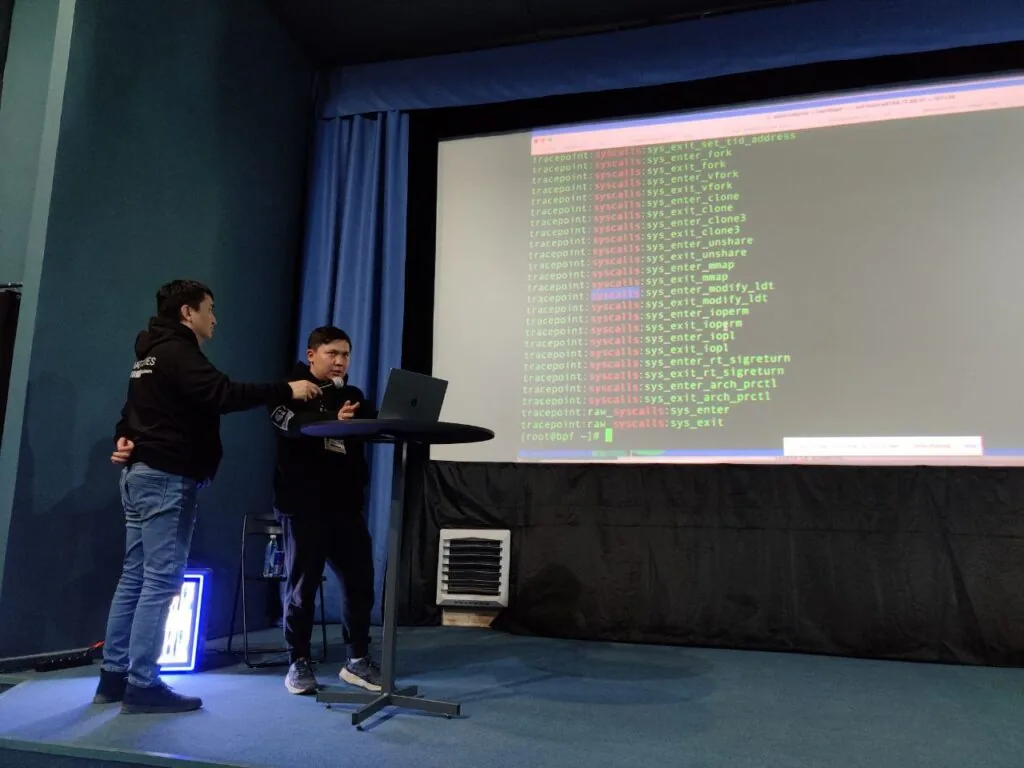
Debugging or debugging is the process of identifying and resolving issues or errors in software systems. It is a critical part of software development and operations, as it helps ensure that applications and systems function as expected.
Before diving into the specifics of debugging Linux with BPF, let's first define what we mean by "Linux environment." The Linux environment refers to the software and hardware components that make up the Linux operating system, including the kernel, system libraries, and user applications.
As a DevOps engineer, understanding how to debug Linux using BPF can help you quickly and effectively identify and resolve issues in your system. In this article, we will explore how BPF can be used for Linux debugging, highlighting its pros and cons, as well as limitations you should be aware of.
What is BPF
BPF, or Berkeley Packet Filter, is a virtual machine running in the Linux kernel. BPF was originally developed for filtering network packets but has since been expanded to other areas such as tracing and profiling, becoming known as eBPF or enhanced BPF. BPF programs can be written in high-level languages such as Python and C++ and can be loaded and unloaded dynamically, making it a powerful tool for monitoring and debugging Linux systems. In other words, with eBPF, you can do practically anything: from "reading the contents of a packet arriving at the network card" to "reading conversations in desktop Telegram."
One of the advantages of eBPF is low overhead. Since BPF runs in kernel space, it can analyze data without needing to copy it to user space, which can significantly reduce the impact on system performance. Additionally, eBPF programs can be loaded and unloaded dynamically, meaning you can update your filters without rebooting the system. Executing eBPF code ensures safe operation in production systems because, before loading into the kernel runtime, the eBPF program runs in a "sandbox," and the kernel verifies that running the program does not harm system operation.
The eBPF Execution Process
To run an eBPF program, two things are required: compiled BPF bytecode and a probe, which is triggered to execute the eBPF code. A probe is a flag, marker, trace, breakpoint implemented in the kernel code, or a library that allows access to data in memory, such as reading the arguments of a specific function.
After compiling the code into BPF bytecode, the bytecode is loaded into the Linux kernel via system calls. The kernel first runs the bytecode through the verifier to check the BPF program. The verifier ensures that the program will not break the kernel, does not have infinite loops, and has sufficient privileges to run. Afterward, the kernel loads the BPF program into its runtime, binding it to a specific probe. When the probe is triggered (a packet arrives/a syscall is called/a function starts), the kernel copies the environment's address space in memory, runs the BPF program, and grants access to the copied address space. Thus, the BPF program can safely read data in memory, process it, and output the necessary information to the user program (maps).
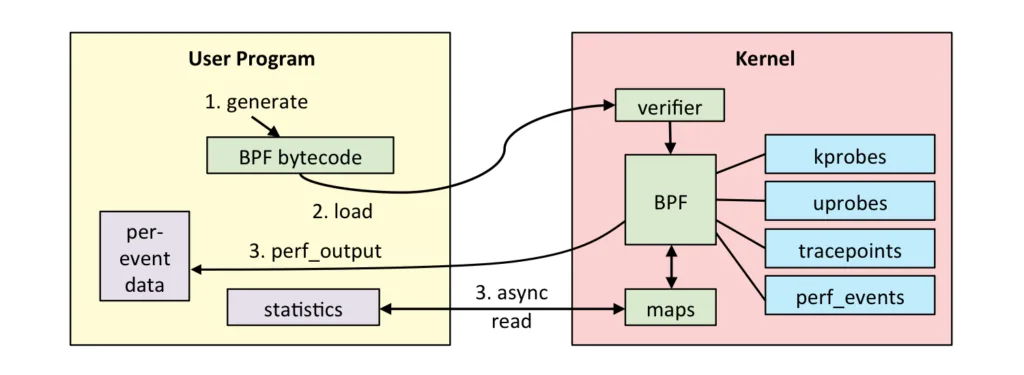
To easily understand how BPF works, you can draw an analogy with message brokers (kafka/rabbitmq), where:
— source (producer) — probe
— receiver (consumer) — eBPF program
— message — environment data, a copy of the object's memory address space.
After loading into the kernel, the BPF program will wait for the probe (message). Each time the bound probe is triggered, the kernel copies the environment (memory) at the moment of that probe's call and runs the loaded BPF program, providing access to this copy of the environment.
Debugging Linux with eBPF
To debug Linux with BPF, you can use ready-made BPF-based utilities such as bcc-tools and bpftrace, or write your own BPF code using the libbcc library. To quickly get started with eBPF, it is sufficient to learn how to use the ready-made utilities bcc-tools and bpftrace, as, in fact, 80% of all eBPF tool needs are covered by these utilities. To start using eBPF, you do not necessarily need to know how to write eBPF programs.
Bcc-tools — a set of ready-made utilities that are installed via the package manager (dnf/apt) into the system and are ready to use "out of the box" after installation. For example, the execsnoop utility shows newly launched processes in real time. This utility is written in Python. By examining the source code, you can easily verify that this eBPF program uses a probe on the execve system call — the system call responsible for launching a process.
Bpft is installed via standard package managers. With bpftrace, you can write a one-liner command that, for example, does the same thing as execsnoop in bcc-tools:race. It is designed for writing one-liner BPF commands/instructions and scripts. It is convenient for quickly testing hypotheses or debugging issues and is also installed via standard package managers. With bpftrace, you can write a one-liner command that, for example, does the same thing as execsnoop in bcc-tools:
bpftrace -e 'tracepoint:syscalls:sys_enter_execve { printf("%-10u %-5d ", elapsed / 1000000, pid); join(args->argv); }'
Tips:
— to show all available probes in bpftrace, use the command: bpftrace -l
— to view the arguments of an interesting probe: bpftrace -vl tracepoint:syscalls:sys_enter_execve.
Pros and Cons of BPF
The main advantage of BPF is low overhead, which allows for system monitoring and debugging without significantly impacting performance. Additionally, since BPF runs in kernel space, it can provide more detailed information than other debugging tools that operate in user space.
However, eBPF has some limitations. Since eBPF is a virtual machine, it may not support all basic hardware functions. Moreover, BPF programs can be complex to write and debug, especially for beginners unfamiliar with low-level programming.
Conclusion
BPF is a powerful tool for debugging Linux that can provide detailed information about your system's performance. Using bcc-tools and bpftrace, you can easily dive into the eBPF technology and gain access to a large number of tools that are periodically updated and improved by the open source community.
Although BPF has some limitations, its low overhead and ability to run in kernel space make it a valuable tool for any DevOps engineer. With a wide range of supported probes, BPF can help you quickly and effectively identify and resolve issues in your Linux environment.
The Tech on Telegram Follow The Tech on Telegram
Keep up with the latest technology and startup news.
Related reading







More from this author

News
zypl.ai begins operations in Japan and focuses on next-generation risk models
Mansur Ismagulov

News
Elon Musk's net worth has exceeded $700 billion for the first time
Mansur Ismagulov

Article Interviews
"Central Asian countries should build a joint ecosystem," — Bekhzod Ismoilov on the development of AI in the region
Mansur Ismagulov

Article Interviews
Bloom's Taxonomy and Engineering Levels: A Practical Growth Model
Mansur Ismagulov

Article Useful
How the IT industry in Azerbaijan developed in 2025: key events
Mansur Ismagulov

News
Tajikistan has become a new member of the regional innovation alliance Central Asian Innovation Hubs.
Mansur Ismagulov